Description
Spectrum Analyzer (9kHz to scope bandwith frequency standard - 9kHz to 3Hz optional)
All MDO3000 Series instruments can be preconfigured from the factory with this SA option.
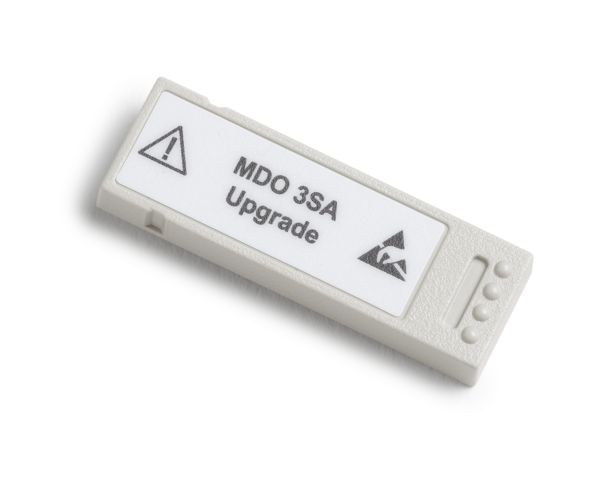
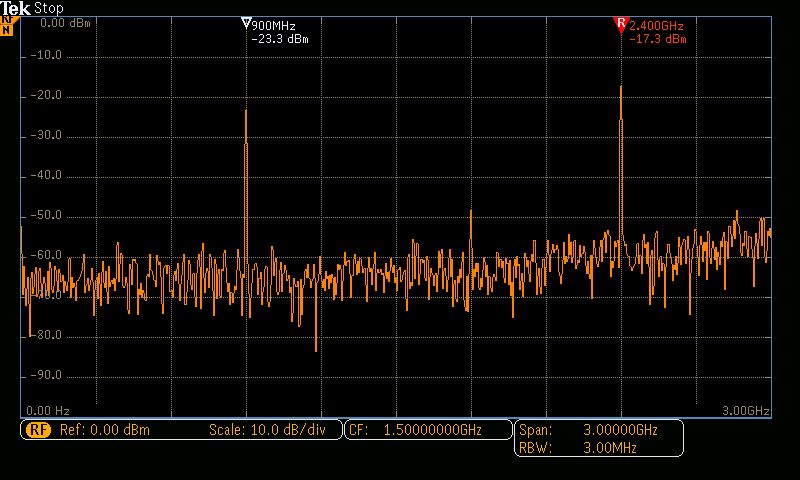
The MDO3000 is the first oscilloscope in its class to include an integrated spectrum analyzer. Each oscilloscope includes a spectrum analyzer with a frequency range of 9 kHz up to the analog bandwidth of the instrument. The spectrum analyzer frequency range of each instrument can be upgraded from 9 kHz to 3 GHz (option MDO3SA), enabling spectral analysis on most consumer wireless standards.
Fast and accurate spectral analysis
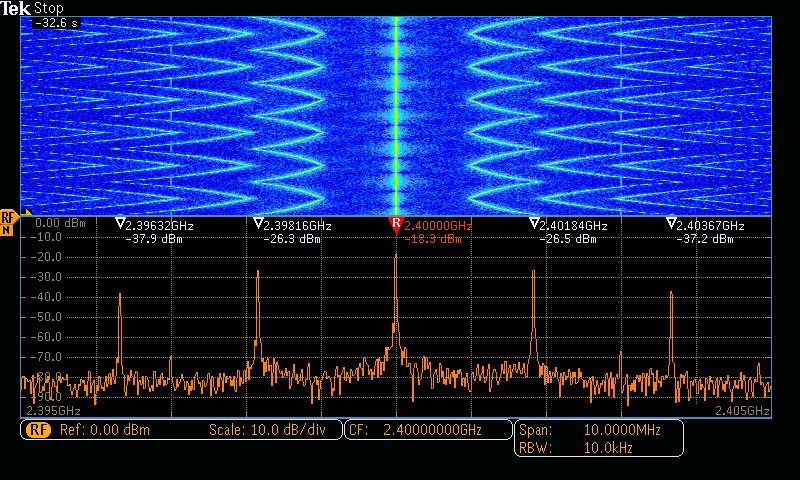
When using the spectrum analyzer input, the MDO3000 Series display becomes a full-screen Frequency Domain view.
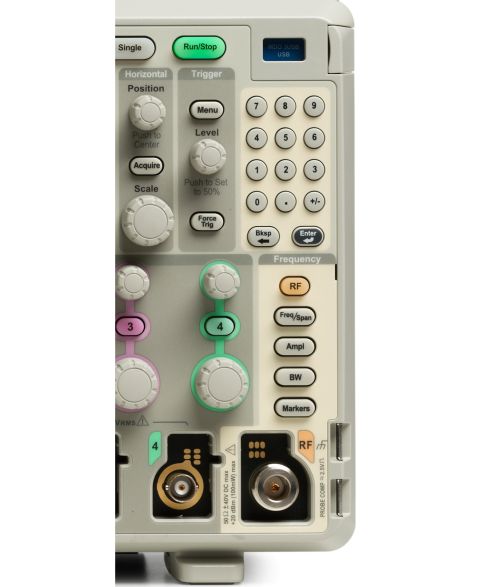
Key spectral parameters such as Center Frequency, Span, Reference Level, and Resolution Bandwidth are all adjusted quickly and easily using the dedicated front-panel menus and keypad.
Intelligent, efficient markers
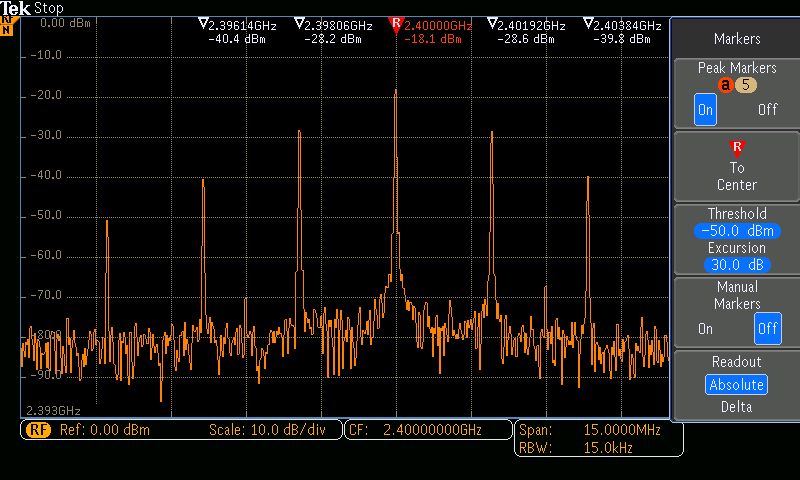
In a traditional spectrum analyzer, it can be a very tedious task to turn on and place enough markers to identify all your peaks of interest. The MDO3000 Series makes this process far more efficient by automatically placing markers on peaks that indicate both the frequency and the amplitude of each peak. You can adjust the criteria that the oscilloscope uses to automatically find the peaks.
The highest amplitude peak is referred to as the reference marker and is shown in red. Marker readouts can be switched between Absolute and Delta readouts. When Delta is selected, marker readouts show each peak's delta frequency and delta amplitude from the reference marker.
Two manual markers are also available for measuring non-peak portions of the spectrum. When enabled, the reference marker is attached to one of the manual markers, enabling delta measurements from anywhere in the spectrum. In addition to frequency and amplitude, manual marker readouts also include noise density and phase noise readouts depending on whether Absolute or Delta readouts are selected. A "Reference Marker to Center" function instantly moves the frequency indicated by the reference marker to center frequency.
Spectrogram
The MDO3000 Series includes a spectrogram display which is ideal for monitoring slowly changing RF phenomena. The x-axis represents frequency, just like a typical spectrum display. However, the y-axis represents time, and color is used to indicate amplitude.
Spectrogram slices are generated by taking each spectrum and "flipping it up on its edge" so that it's one pixel row tall, and then assigning colors to each pixel based on the amplitude at that frequency. Cold colors (blue, green) are low amplitude and hotter colors (yellow, red) are higher amplitude. Each new acquisition adds another slice at the bottom of the spectrogram and the history moves up one row. When acquisitions are stopped, you can scroll back through the spectrogram to look at any individual spectrum slice.
Ultra-wide capture bandwidth
Today's wireless communications vary significantly with time, using sophisticated digital modulation schemes and, often, transmission techniques that involve bursting the output. These modulation schemes can have very wide bandwidth as well. Traditional swept or stepped spectrum analyzers are ill equipped to view these types of signals as they are only able to look at a small portion of the spectrum at any one time.
The amount of spectrum acquired in one acquisition is called the capture bandwidth. Traditional spectrum analyzers sweep or step the capture bandwidth through the desired span to build the requested image. As a result, while the spectrum analyzer is acquiring one portion of the spectrum, the event you care about may be happening in another portion of the spectrum. Most spectrum analyzers on the market today have 10 MHz capture bandwidths, sometimes with expensive options to extend that to 20, 40, or even 160 MHz in some cases.
In order to address the bandwidth requirements of modern RF, the MDO3000 Series provides up to 3 GHz of capture bandwidth. The spectrum is generated from a single acquisition, thus guaranteeing you'll see the events you're looking for in the frequency domain.
Spectrum traces
The MDO3000 Series spectrum analyzer offers four different traces or views including Normal, Average, Max Hold, and Min Hold.
RF measurements
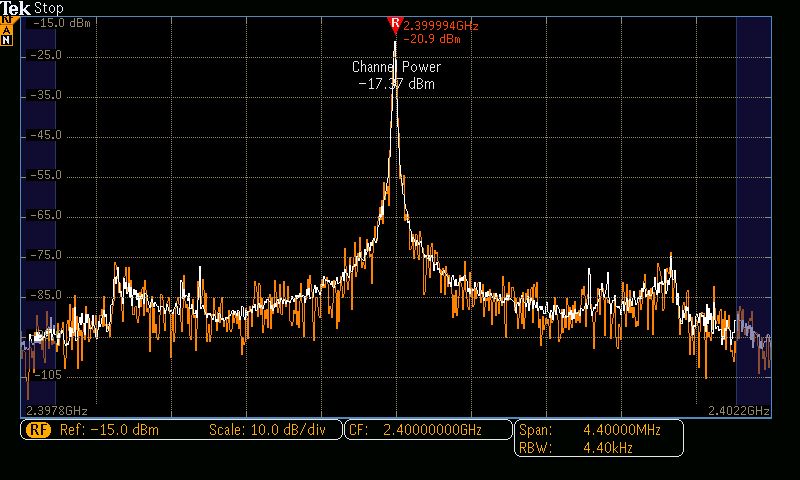
The MDO3000 Series includes three automated RF measurements - Channel Power, Adjacent Channel Power Ratio, and Occupied Bandwidth. When one of these RF measurements is activated, the oscilloscope automatically turns on the Average spectrum trace and sets the detection method to Average for optimal measurement results.
Advanced RF analysis
The MDO3000 can save the baseband I and Q data from spectrum analyzer acquisitions to a .TIQ file. These files can then be imported into Tektronix SignalVu-PC software for general purpose modulation and pulse analysis or RSAVu for analysis of commercial wireless standards.
RF probing
Signal input methods on spectrum analyzers are typically limited to cabled connections or antennas. But with the optional TPA-N-VPI adapter, any active, 50 Ω TekVPI probe can be used with the spectrum analyzer on the MDO3000 Series. This enables additional flexibility when hunting for noise sources and enables easier spectral analysis by using true signal browsing on a spectrum analyzer input.
In addition, an optional preamplifier accessory assists in the investigation of lower-amplitude signals. The TPA-N-PRE preamplifier provides 10 dB nominal gain across the 9 kHz – 3 GHz frequency range.

